Dashboard
The Dashboard provides a real-time overview of your key performance metrics and analytics. Monitor conversations, calls, leads, and revenue at a glance.
Accessing the Dashboard
The Dashboard is the default view when you open the app. You can also access it by tapping Dashboard in the navigation drawer.
Quick Access Icons
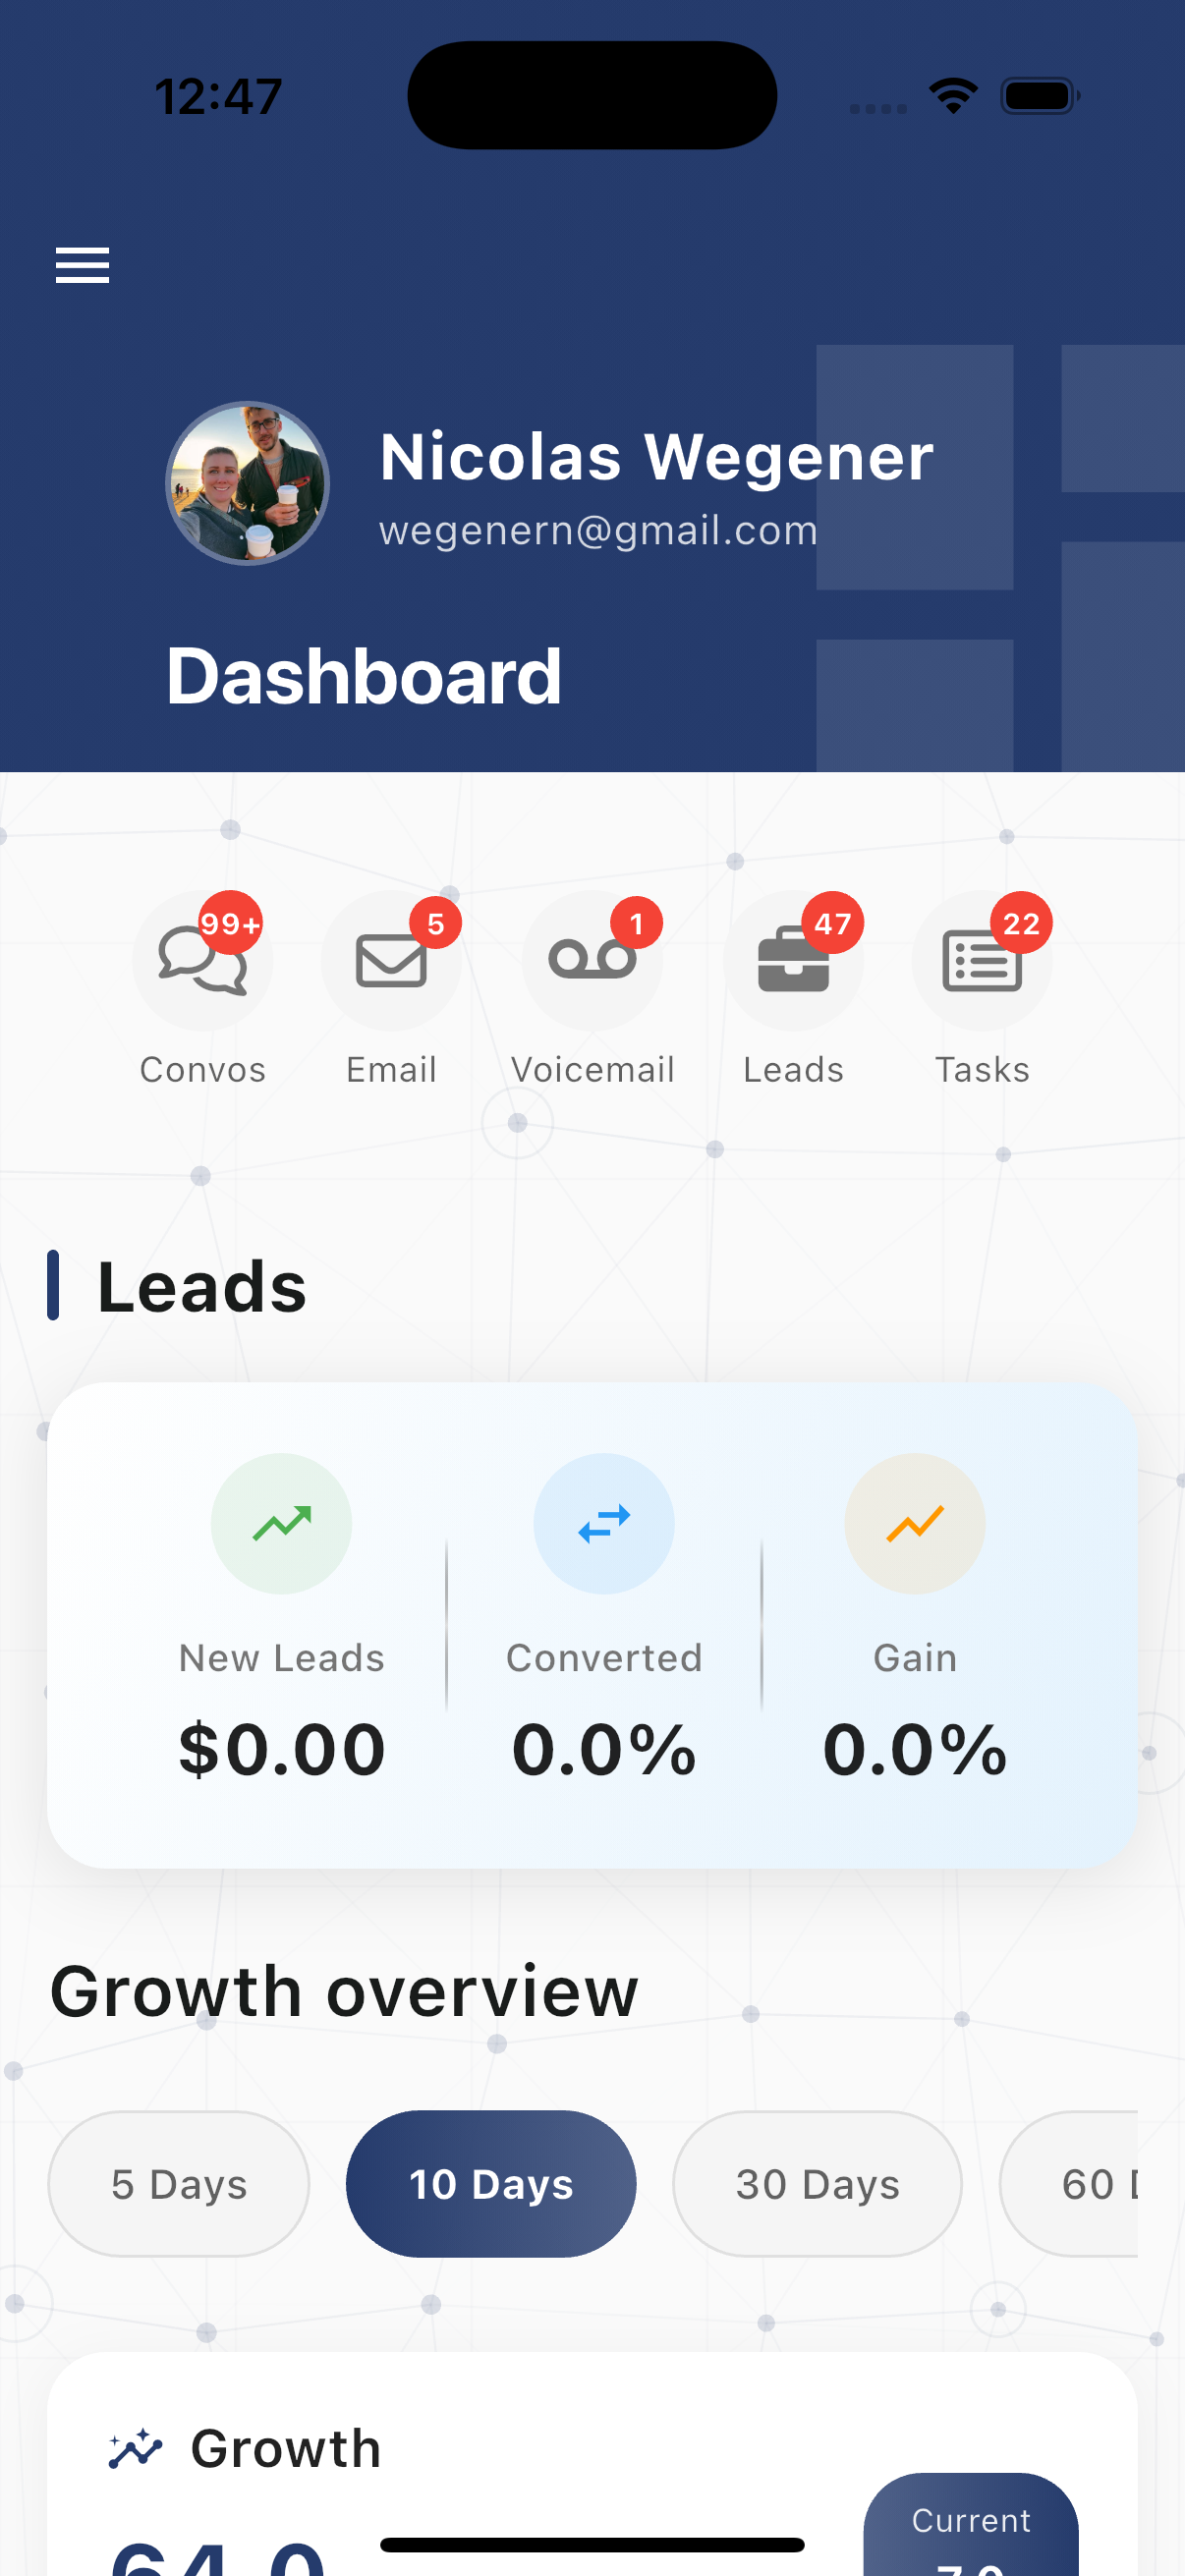
At the top of the dashboard, you'll find quick access icons with badge counts:
- Convos - Conversations requiring attention
- Email - Unread emails
- Voicemail - New voicemails
- Leads - Active leads
- Tasks - Pending tasks
Tap any icon to jump directly to that section.
Available Metrics
The dashboard displays interactive widgets showing key performance indicators:
Conversation Metrics
- Total conversations
- Open conversations
- Completed conversations
- Response times
Messaging Volume
- SMS messages sent/received
- Email volume
- WhatsApp messages
- Voicemail count
Call Analytics
- Total calls
- Inbound vs outbound
- Call duration averages
- Missed calls
Lead Performance
- New leads
- Lead conversion rates
- Leads by status
- Pipeline value
Revenue & Growth
- Revenue tracking
- Growth trends
- Performance comparisons
Time Period Selection
View metrics for different time ranges:
- 30 Days - Last 30 days of activity
- 90 Days - Last 90 days for trend analysis
Tap the time period selector to switch between views.
Interactive Charts
Tap on any chart or metric widget to:
- View detailed breakdowns
- See trend data over time
- Drill down into specific categories
Refreshing Data
- Pull down on the dashboard to refresh all metrics
- Data updates automatically when you return to the dashboard
- Real-time updates for active conversations and calls
Widget Types
The dashboard includes various visualization types:
- Summary cards - Key numbers at a glance
- Line charts - Trends over time
- Bar charts - Comparative data
- Progress indicators - Goal tracking
Best Practices
- Check the dashboard at the start of each day to understand workload
- Use 90-day view to identify trends and patterns
- Monitor lead metrics to track pipeline health
- Review call analytics to optimize response times