Analytics & Reports
The Analytics section provides comprehensive reporting capabilities to analyze your marketing performance, call center operations, SMS campaigns, and agent productivity through a variety of pre-built reports.
Accessing Reports
- Navigate to Reports in the main menu
- Select a report type from the dropdown
- Configure date ranges and filters
- Click Run Report to generate results
- Download results as CSV if needed
Available Report Types
Email Campaign Reports
Email Campaign Revenue
Track revenue attribution from email campaigns to understand campaign ROI and effectiveness. This report links reservations back to the campaigns that influenced them.
Key Metrics:
- Reservation #: Booking reference number
- Campaign ID: Associated email campaign identifier
- Campaign Name: Human-readable campaign name
- Revenue Amount: Total revenue generated (formatted as currency)
- Booking Date: When the reservation was created
- Arrival Date: Guest check-in date
- Contact Name: Guest who made the booking
- Attribution Type: Direct click, soft association, or last touch
Use Cases:
- Calculate ROI for specific email campaigns
- Identify highest revenue-generating campaigns
- Track conversion time from email to booking
- Analyze seasonal campaign performance
Email Campaign Overview
Get a comprehensive view of all email campaign performance metrics in one report. Perfect for comparing campaign effectiveness and identifying trends.
Key Metrics:
- Campaign Name: Email campaign identifier
- Total Sent: Number of emails delivered
- Opens: Total unique opens
- Open Rate: Percentage of recipients who opened
- Clicks: Total unique clicks
- Click Rate: Percentage of recipients who clicked
- Unsubscribes: Number of opt-outs
- Bounces: Failed deliveries
- Spam Reports: Complaints received
Use Cases:
- Compare engagement across campaigns
- Identify best-performing subject lines
- Monitor list health through bounce rates
- Optimize send times based on engagement
Call Center Reports
Call Volume Stats
High-level overview of your call center's performance, providing essential metrics for capacity planning and service level monitoring.
Key Metrics:
- Total Calls: All calls handled in period
- Failed Calls: Calls that didn't connect
- Abandoned Calls: Caller hung up before answer
- Average Wait Time: Mean time before agent pickup
- Service Level: % answered within threshold
- Total Talk Time: Aggregate conversation duration
- Average Handle Time: Mean call duration including wrap-up
Use Cases:
- Monitor daily call center health
- Plan staffing requirements
- Identify service level issues
- Track operational efficiency
Call Volume by Day
Analyze call patterns across days to identify trends, plan resources, and understand customer behavior patterns.
Key Metrics:
- Date: Calendar day
- Total Calls: All calls for that day
- Failed Calls: Technical failures
- Outbound Calls: Agent-initiated calls
- Inbound Calls: Customer-initiated calls
- Average Duration: Mean call length
- Peak Hour: Busiest hour of day
- Unique Callers: Distinct phone numbers
Use Cases:
- Identify busiest days of week/month
- Plan holiday staffing
- Track growth trends
- Correlate with marketing campaigns
Call Volume by Hour
Detailed hourly breakdown helps optimize staffing schedules and identify peak service times.
Key Metrics:
- Hour: Time period (0-23)
- Total Calls: Volume for that hour
- Average Wait: Mean queue time
- Abandoned Rate: % who hung up waiting
- Average Duration: Mean call length
- Agents Available: Staff count
- Service Level: % answered quickly
Use Cases:
- Create optimal shift schedules
- Identify understaffed periods
- Plan break times effectively
- Measure lunch hour impact
Call Volume by Agent
Individual agent performance metrics for coaching, recognition, and workload balancing.
Key Metrics:
- Agent Name: Staff member identifier
- Total Calls: Calls handled by agent
- Inbound Handled: Customer calls answered
- Outbound Made: Calls initiated
- Average Talk Time: Mean conversation duration
- Total Talk Time: Aggregate duration
- Wrap Time: Post-call work time
- Status Time: Time in each status
Use Cases:
- Performance reviews and coaching
- Identify training needs
- Balance workload distribution
- Recognize top performers
Call Stats
Granular call-level data for detailed analysis and troubleshooting specific interactions.
Key Metrics:
- Call ID: Unique identifier
- Segments: Number of call parts/transfers
- Total Seconds: Complete duration
- Billed Seconds: Chargeable time
- Ring Time: Time before answer
- Talk Time: Conversation duration
- Hold Time: Customer on hold
- Call Status: Outcome (completed, failed, etc.)
- From Number: Caller phone
- To Number: Destination
- Direction: Inbound/Outbound
Use Cases:
- Investigate specific calls
- Analyze transfer patterns
- Calculate telephony costs
- Quality assurance reviews
Call Type
Categorize calls by purpose to understand customer needs and optimize service delivery.
Key Metrics:
- Call Type: Category (sales, support, etc.)
- Total Count: Number of calls
- Average Duration: Mean time by type
- Conversion Rate: Success percentage
- Transfer Rate: % requiring escalation
- First Call Resolution: % resolved immediately
Use Cases:
- Train agents on common issues
- Identify process improvements
- Allocate specialized resources
- Measure resolution effectiveness
Call Inbound Source Totals
Track which marketing channels and sources drive phone calls to measure campaign effectiveness.
Key Metrics:
- Source: Marketing channel/campaign
- Total Calls: Calls from source
- Unique Callers: Distinct numbers
- Average Duration: Mean call length
- Conversion Rate: % resulting in booking
- Revenue Generated: Total value
Use Cases:
- Measure marketing ROI
- Optimize advertising spend
- Identify best lead sources
- Track campaign performance
SMS Reports
SMS Volume Stats
Overview of SMS messaging performance including delivery rates and engagement metrics.
Key Metrics:
- Total Messages: SMS sent in period
- Total Segments: Message parts (160 char segments)
- Inbound Messages: Replies received
- Outbound Messages: Messages sent
- Delivered: Successful delivery
- Failed: Delivery failures
- Opt-outs: Unsubscribe requests
Use Cases:
- Monitor SMS program health
- Track delivery reliability
- Calculate messaging costs
- Measure engagement rates
SMS Volume Stats by Day
Daily SMS activity patterns to optimize send times and understand customer preferences.
Key Metrics:
- Date: Calendar day
- Total Sent: Messages dispatched
- Delivered: Successful deliveries
- Failed: Delivery failures
- Replies: Inbound responses
- Opt-out Rate: Daily unsubscribes
- Engagement Rate: Reply percentage
Use Cases:
- Identify best send days
- Track campaign performance
- Monitor list health
- Plan message scheduling
SMS Volume Stats by Hour
Hourly SMS metrics to find optimal send times for maximum engagement.
Key Metrics:
- Hour: Time period
- Messages Sent: Volume per hour
- Delivery Rate: Success percentage
- Response Rate: Reply percentage
- Response Time: Average reply speed
- Opt-outs: Hourly unsubscribes
Use Cases:
- Optimize send times
- Avoid quiet hours
- Maximize open rates
- Improve response rates
Agent Performance Reports
Accessing Agent Performance Data
To get comprehensive agent performance data, use two complementary approaches:
-
Agent Productivity Report (Reports → Agent Productivity)
- Shows what agents were logged on during the selected period
- Displays detailed breakdown of agent activities and time utilization
-
Agent Action Events (Global Settings → Action Events)
- Located at the bottom of the Global Settings page
- Select agents, date range, and specific agent to view
- Outlines all agent events including:
- Log on times (first pending state)
- Log out times
- State changes throughout the day
- Complete activity timeline
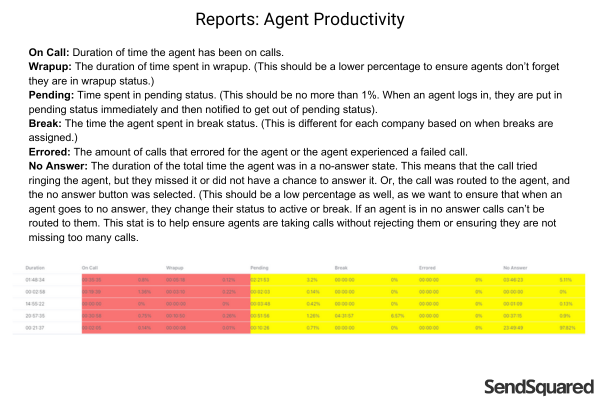
Agent Productivity
Comprehensive view of agent time utilization across different statuses and activities.
Key Metrics:
- Agent Name: Staff identifier
- Total Time: Hours logged in
- Available Time: Ready for calls
- Talk Time: On calls (Duration of time the agent has been on calls)
- Wrap Time: Post-call work (Should be a lower percentage to ensure agents don't forget they are in wrapup)
- Break Time: Away from desk (Time assigned for breaks based on company policy)
- Idle Time: Available but unused
- Pending Time: Time spent in pending status (No more than 1%, indicates immediate notification when agent logs in)
- Errored: Calls that errored for the agent or experienced a failed call
- No Answer: Duration of time agent was in no answer state (Should be low percentage, indicates agent tried ringing but didn't answer)
- Percentage Breakdown: Time distribution
Important Notes:
- Agents taking calls without rejecting ensures they are not missing too many calls
- If an agent is in no answer calls, they can't be routed to them
- Helps ensure agents are taking calls without rejecting them or ensuring they are not missing too many calls
Use Cases:
- Optimize agent utilization
- Identify efficiency opportunities
- Balance workloads
- Improve scheduling
- Monitor agent compliance with break policies
- Identify training needs based on status patterns
Agent Productivity Live
Real-time snapshot of current agent status and activities for floor management.
Key Metrics:
- Agent Name: Staff identifier
- Current Status: Available, On Call, Break, etc.
- Status Duration: Time in current state
- Calls Today: Daily count
- Average Handle Time: Today's average
- Current Call Duration: If on call
- Queue Calls Waiting: System backlog
Use Cases:
- Real-time floor management
- Immediate resource allocation
- Break coordination
- Service level management
Agent Booked Revenue
Link agent performance directly to revenue generation for commission and recognition.
Key Metrics:
- Agent Name: Staff identifier
- Total Bookings: Reservations created
- Revenue Generated: Total value
- Average Booking Value: Mean transaction
- Conversion Rate: Leads to bookings
- Commission Earned: If applicable
- Period Total: Sum for date range
Use Cases:
- Calculate commissions
- Recognize top performers
- Set revenue goals
- Track sales effectiveness
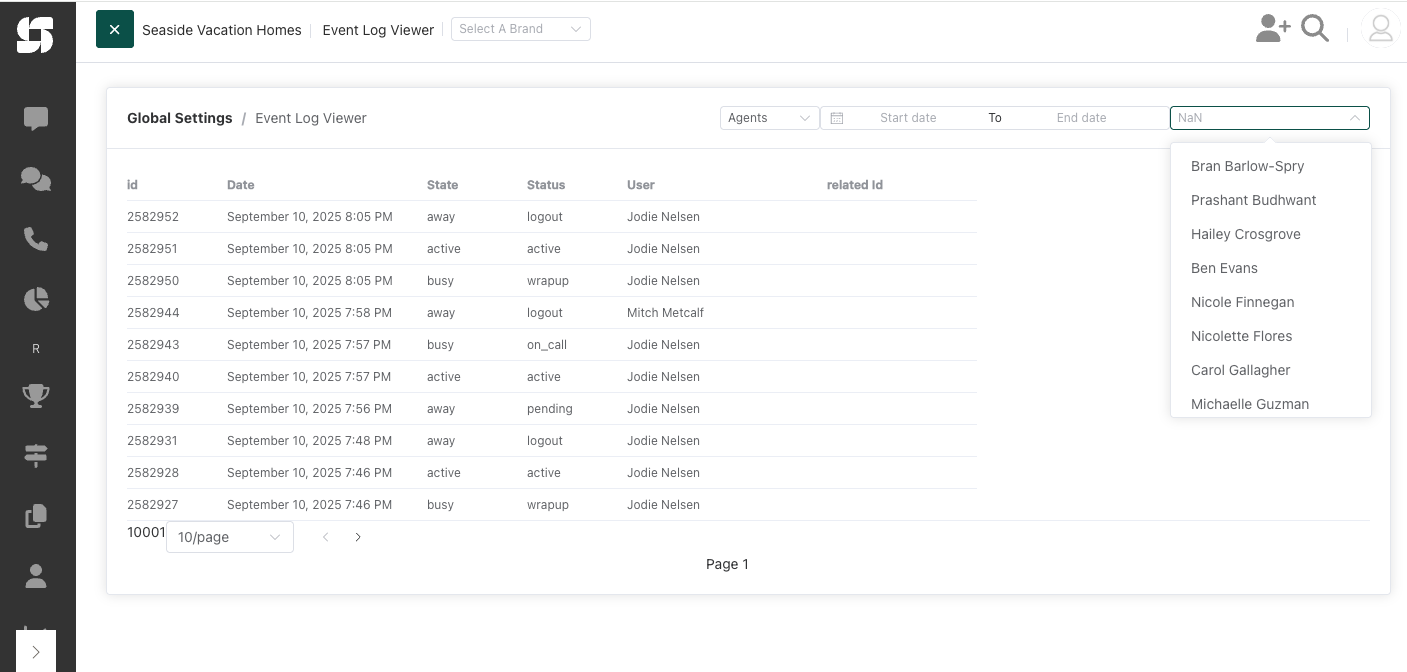
Agent Action Events
Detailed timeline view of all agent activities and state changes accessible through Global Settings.
Access Path: Global Settings → Action Events (bottom of page)
Configuration Options:
- Agent Selection: Choose specific agents or all agents
- Date Range: Select start and end dates for the report period
- Action Filters: Filter by specific action types (Agents, Triggers, Connectors, Actions)
Event Data Captured:
- Event ID: Unique identifier for each action
- Date/Time: Precise timestamp of each event
- State: Current agent state (active, away, busy)
- Status: Specific status detail (active, logout, on_call, wrapup, pending)
- User: Agent name associated with the event
- Related ID: Associated record or call ID when applicable
Common Agent States:
- Active: Agent is available and ready for calls
- Away: Agent is logged in but temporarily unavailable
- Busy: Agent is handling a call or in wrap-up
- Pending: Initial state when agent first logs in
- Logout: Agent has ended their session
Use Cases:
- Track exact login/logout times for payroll
- Monitor state changes throughout the day
- Identify patterns in agent behavior
- Audit agent activity for compliance
- Investigate specific incidents or time periods
- Calculate actual working hours vs scheduled hours
Lead & Revenue Reports
Lead Revenue
Comprehensive lead-to-revenue tracking showing the complete journey from inquiry to booking.
Key Metrics:
- Agent: Assigned staff member
- Total Leads: All inquiries
- Closed Leads: Converted to bookings
- Lost Leads: Did not convert
- Close Rate: Conversion percentage
- Total Revenue: From closed leads
- Average Lead Value: Revenue per lead
- Time to Close: Average days to convert
Use Cases:
- Measure sales effectiveness
- Calculate lead value
- Optimize follow-up timing
- Identify top closers
Lead Revenue Source
Understand which marketing channels generate the most valuable leads.
Key Metrics:
- Lead Source: Origin channel
- Total Leads: Volume from source
- Conversion Rate: % that book
- Revenue Generated: Total value
- Average Value: Per lead revenue
- Cost per Lead: If tracked
- ROI: Return on investment
Use Cases:
- Optimize marketing spend
- Focus on best sources
- Calculate channel ROI
- Plan budget allocation
Lead Lost Reason
Analyze why leads don't convert to identify improvement opportunities.
Key Metrics:
- Lead Status: Current state
- Lost Reason: Why not converted
- Agent: Who handled lead
- Total Value: Potential revenue lost
- Count: Number of leads
- Percentage: Of total lost
- Average Days Open: Before closing
Use Cases:
- Identify common objections
- Improve sales training
- Address pricing issues
- Enhance property offerings
Business Performance Reports
Daily Snapshot
Executive summary of key business metrics for quick daily performance review.
Key Metrics:
- Metric Type: Category of measurement
- All Bookings: Total reservations
- Paid Bookings: Confirmed with payment
- Cancellations: Bookings cancelled
- Total Revenue: Daily income
- Occupancy Rate: If applicable
- Lead Count: New inquiries
- Conversion Rate: Leads to bookings
Use Cases:
- Morning management review
- Track against goals
- Identify issues quickly
- Celebrate successes
Automation Count
Monitor the performance and execution of your automated workflows and campaigns.
Key Metrics:
- Automation Name: Workflow identifier
- Execution Count: Times triggered
- Success Rate: Completed successfully
- Failed Executions: Errors encountered
- Recipients Affected: Contacts processed
- Messages Sent: Emails/SMS delivered
- Average Duration: Processing time
Use Cases:
- Monitor automation health
- Identify failing workflows
- Track automation usage
- Optimize performance
Report Features
Date Range Selection
- Single Date: For daily reports
- Date Range: For period analysis
- Preset Ranges:
- This month
- This year
- Past year
- Custom ranges
Filtering Options
Reports support various filters based on type:
- Timezone: Adjust for local time analysis (Eastern, Central, Mountain, Pacific)
- Workflow: Filter by specific automations
- Agent: Individual agent performance
- Lead Types: Filter by lead categories (if multiple configured)
- Campaign: Specific campaign analysis
- Reservation Types: For property-specific reports
- Group By: Month, Week, Day of Week (where applicable)
- Time Filters: Specific hour ranges for granular analysis
Data Visualization
Table Display
- Sortable columns (click headers)
- Color-coded metrics (green/yellow/red for performance)
- Expandable rows for details
- Footer totals for summable columns
Column Types
- Currency: Financial values ($X,XXX.XX)
- Percentage: Rates and ratios (XX.XX%)
- Duration: Time-based metrics (HH:MM:SS or Xd HH:MM:SS)
- Numbers: Count metrics with thousand separators
- Dates: Formatted timestamps in local timezone
- Agent Names: Staff identification with full names
Export Functionality
CSV Download
- Run your report with desired filters
- Click Download button
- Enter custom filename
- Confirm download
- File downloads with all visible data
Export Features
- Custom filename support
- All visible columns included
- Formatted values (currencies, percentages maintained)
- Date/time stamped with report run time
- Compatible with Excel, Google Sheets, etc.
Report Formatting
Data Types
Reports automatically format data based on type:
- Currency: $X,XXX.XX format with proper rounding
- Percentages: XX.XX% format with two decimal places
- Duration: HH:MM:SS or Xd HH:MM:SS for longer periods
- Phone Numbers: Formatted with standard display
- Dates: Locale-specific formatting based on timezone
Color Coding
Some reports use color indicators:
- Green: Good performance or positive trends
- Yellow: Warning level or needs attention
- Red: Poor performance or urgent issues
Performance Optimization
Best Practices
- Use specific date ranges to reduce load time (avoid year+ ranges)
- Apply filters to focus on relevant data
- Export large datasets for offline analysis
- Schedule reports during off-peak hours (early morning)
Report Limits
- Maximum 10,000 rows displayed in browser
- Larger datasets available via export
- Some reports may timeout with 1+ year ranges
- Filter to improve performance
Common Use Cases
Daily Operations
- Run Daily Snapshot each morning
- Check Agent Productivity Live throughout day
- Monitor Call Volume Stats for service levels
- Review SMS Volume Stats for delivery issues
Weekly Analysis
- Compare week-over-week with Call Volume by Day
- Review Email Campaign Overview for engagement
- Analyze Lead Revenue for sales performance
- Check Agent Productivity for coaching needs
Monthly Reporting
- Email Campaign Revenue for ROI analysis
- Lead Revenue Source for marketing decisions
- Agent Booked Revenue for commissions
- Lead Lost Reason for process improvements
Strategic Planning
- Use Call Volume by Hour for staffing models
- Analyze Call Inbound Source for budget allocation
- Review Automation Count for workflow optimization
- Study SMS Volume by Hour for send time optimization
Tips for Success
Regular Monitoring
- Schedule daily reports for consistency
- Set up weekly performance reviews
- Create monthly executive summaries
- Track trends, not just snapshots
Data Analysis
- Compare similar time periods (week vs week)
- Look for patterns and anomalies
- Combine reports for deeper insights
- Act on data, don't just collect it
Report Scheduling
- Run heavy reports overnight
- Export monthly archives
- Share reports with stakeholders
- Document insights and actions taken