Call Volume By Day Report
The Call Volume By Day report provides a daily breakdown of all call activity, categorizing calls by direction (inbound/outbound), answer status, and queue activity. Each row represents one day within your selected date range.
Report Columns
| Column | Description |
|---|---|
| Date | The calendar date |
| Total Calls | Total number of calls on that day |
| Failed Calls | Calls with a status of "failed" (did not connect) |
| Outbound | Number of outbound (agent-initiated) calls |
| Outbound Answered | Number of outbound calls that were answered |
| Inbound | Number of inbound (customer-initiated) calls |
| Inbound Answered | Number of inbound calls that were answered by an agent |
| Queue Calls | Number of inbound calls that entered the call queue |
| Queue Answered | Number of queued inbound calls that were answered |
| Answer Time | Average time (in seconds) from when an inbound call entered the queue until it was answered |
| Handle Time | Average time (in seconds) from when an inbound queued call was answered until the call ended |
| Hangups | Number of inbound queued calls that were not answered (caller hung up while waiting) |
| Completed | Number of calls with a status of "completed" |
| Transfers | Number of calls with a status of "transfer" |
| Voicemails | Number of calls that resulted in a voicemail |
How the Numbers Are Computed
Total Calls
Count of all calls (inbound and outbound) on that day.
Failed Calls
Calls where call_status = 'failed'. These are calls that did not connect due to technical issues.
Outbound / Outbound Answered
- Outbound: Calls where
direction = 'outbound' - Outbound Answered: Outbound calls where
answered_atis set
Inbound / Inbound Answered
- Inbound: Calls where
direction = 'inbound' - Inbound Answered: Inbound calls where
answered_atis set
Queue Calls / Queue Answered
- Queue Calls: Inbound calls where
queued_atis set, meaning the call entered the queue system - Queue Answered: Inbound calls that were both queued (
queued_atset) and answered (answered_atset)
Answer Time / Handle Time
- Answer Time: Average seconds from
queued_attoanswered_atacross all inbound queued calls that were answered that day. Measures how long callers waited in the queue. - Handle Time: Average seconds from
answered_attoend_timeacross all inbound queued calls that were answered that day. Measures how long the agent spent on the call.
Hangups / Completed / Transfers / Voicemails
- Hangups: Inbound calls that entered the queue but were never answered
- Completed: Calls with
call_status = 'completed' - Transfers: Calls with
call_status = 'transfer' - Voicemails: Calls that resulted in a voicemail (identified by an associated voicemail record)
Timezone Handling
Dates are grouped after converting call timestamps to your selected timezone. This ensures calls that occurred late at night are attributed to the correct local date.
Totals Row
The Totals row at the bottom sums all columns across all days.
Report Filters
Date Range
- From/To: Select the date range for calls to analyze
- Example: Jan-01-2026 to Jan-31-2026
Timezone
- Purpose: Determines how calls are grouped into days
- Options: Select from available timezones (e.g., Central, Eastern, Pacific)
Understanding the Results
Example Row
| Date | Total Calls | Failed Calls | Outbound | Outbound Answered | Inbound | Inbound Answered | Queue Calls | Queue Answered |
|---|---|---|---|---|---|---|---|---|
| Jan 6, 2026 | 5 | 0 | 1 | 1 | 4 | 0 | 0 | 0 |
This shows:
- 5 total calls on January 6th
- No failed calls
- 1 outbound call that was answered
- 4 inbound calls, none of which were answered by an agent
- No calls entered the queue system that day
Days With No Calls
Days with zero calls within your date range will not appear in the report. Only days with at least one call are shown.
Use Cases
Staffing Planning
- Identify busiest days of the week or month
- Plan staffing levels based on daily call patterns
- Spot trends in call volume growth or decline
Service Level Monitoring
- Compare inbound calls vs inbound answered to track answer rates by day
- Monitor queue answered rates to ensure service levels
- Identify days with high unanswered call rates
Campaign Correlation
- Correlate call volume spikes with marketing campaigns
- Track outbound calling activity by day
- Measure the impact of promotions on inbound volume
Related Reports
- Call Volume By Hour: Same metrics broken down by hour
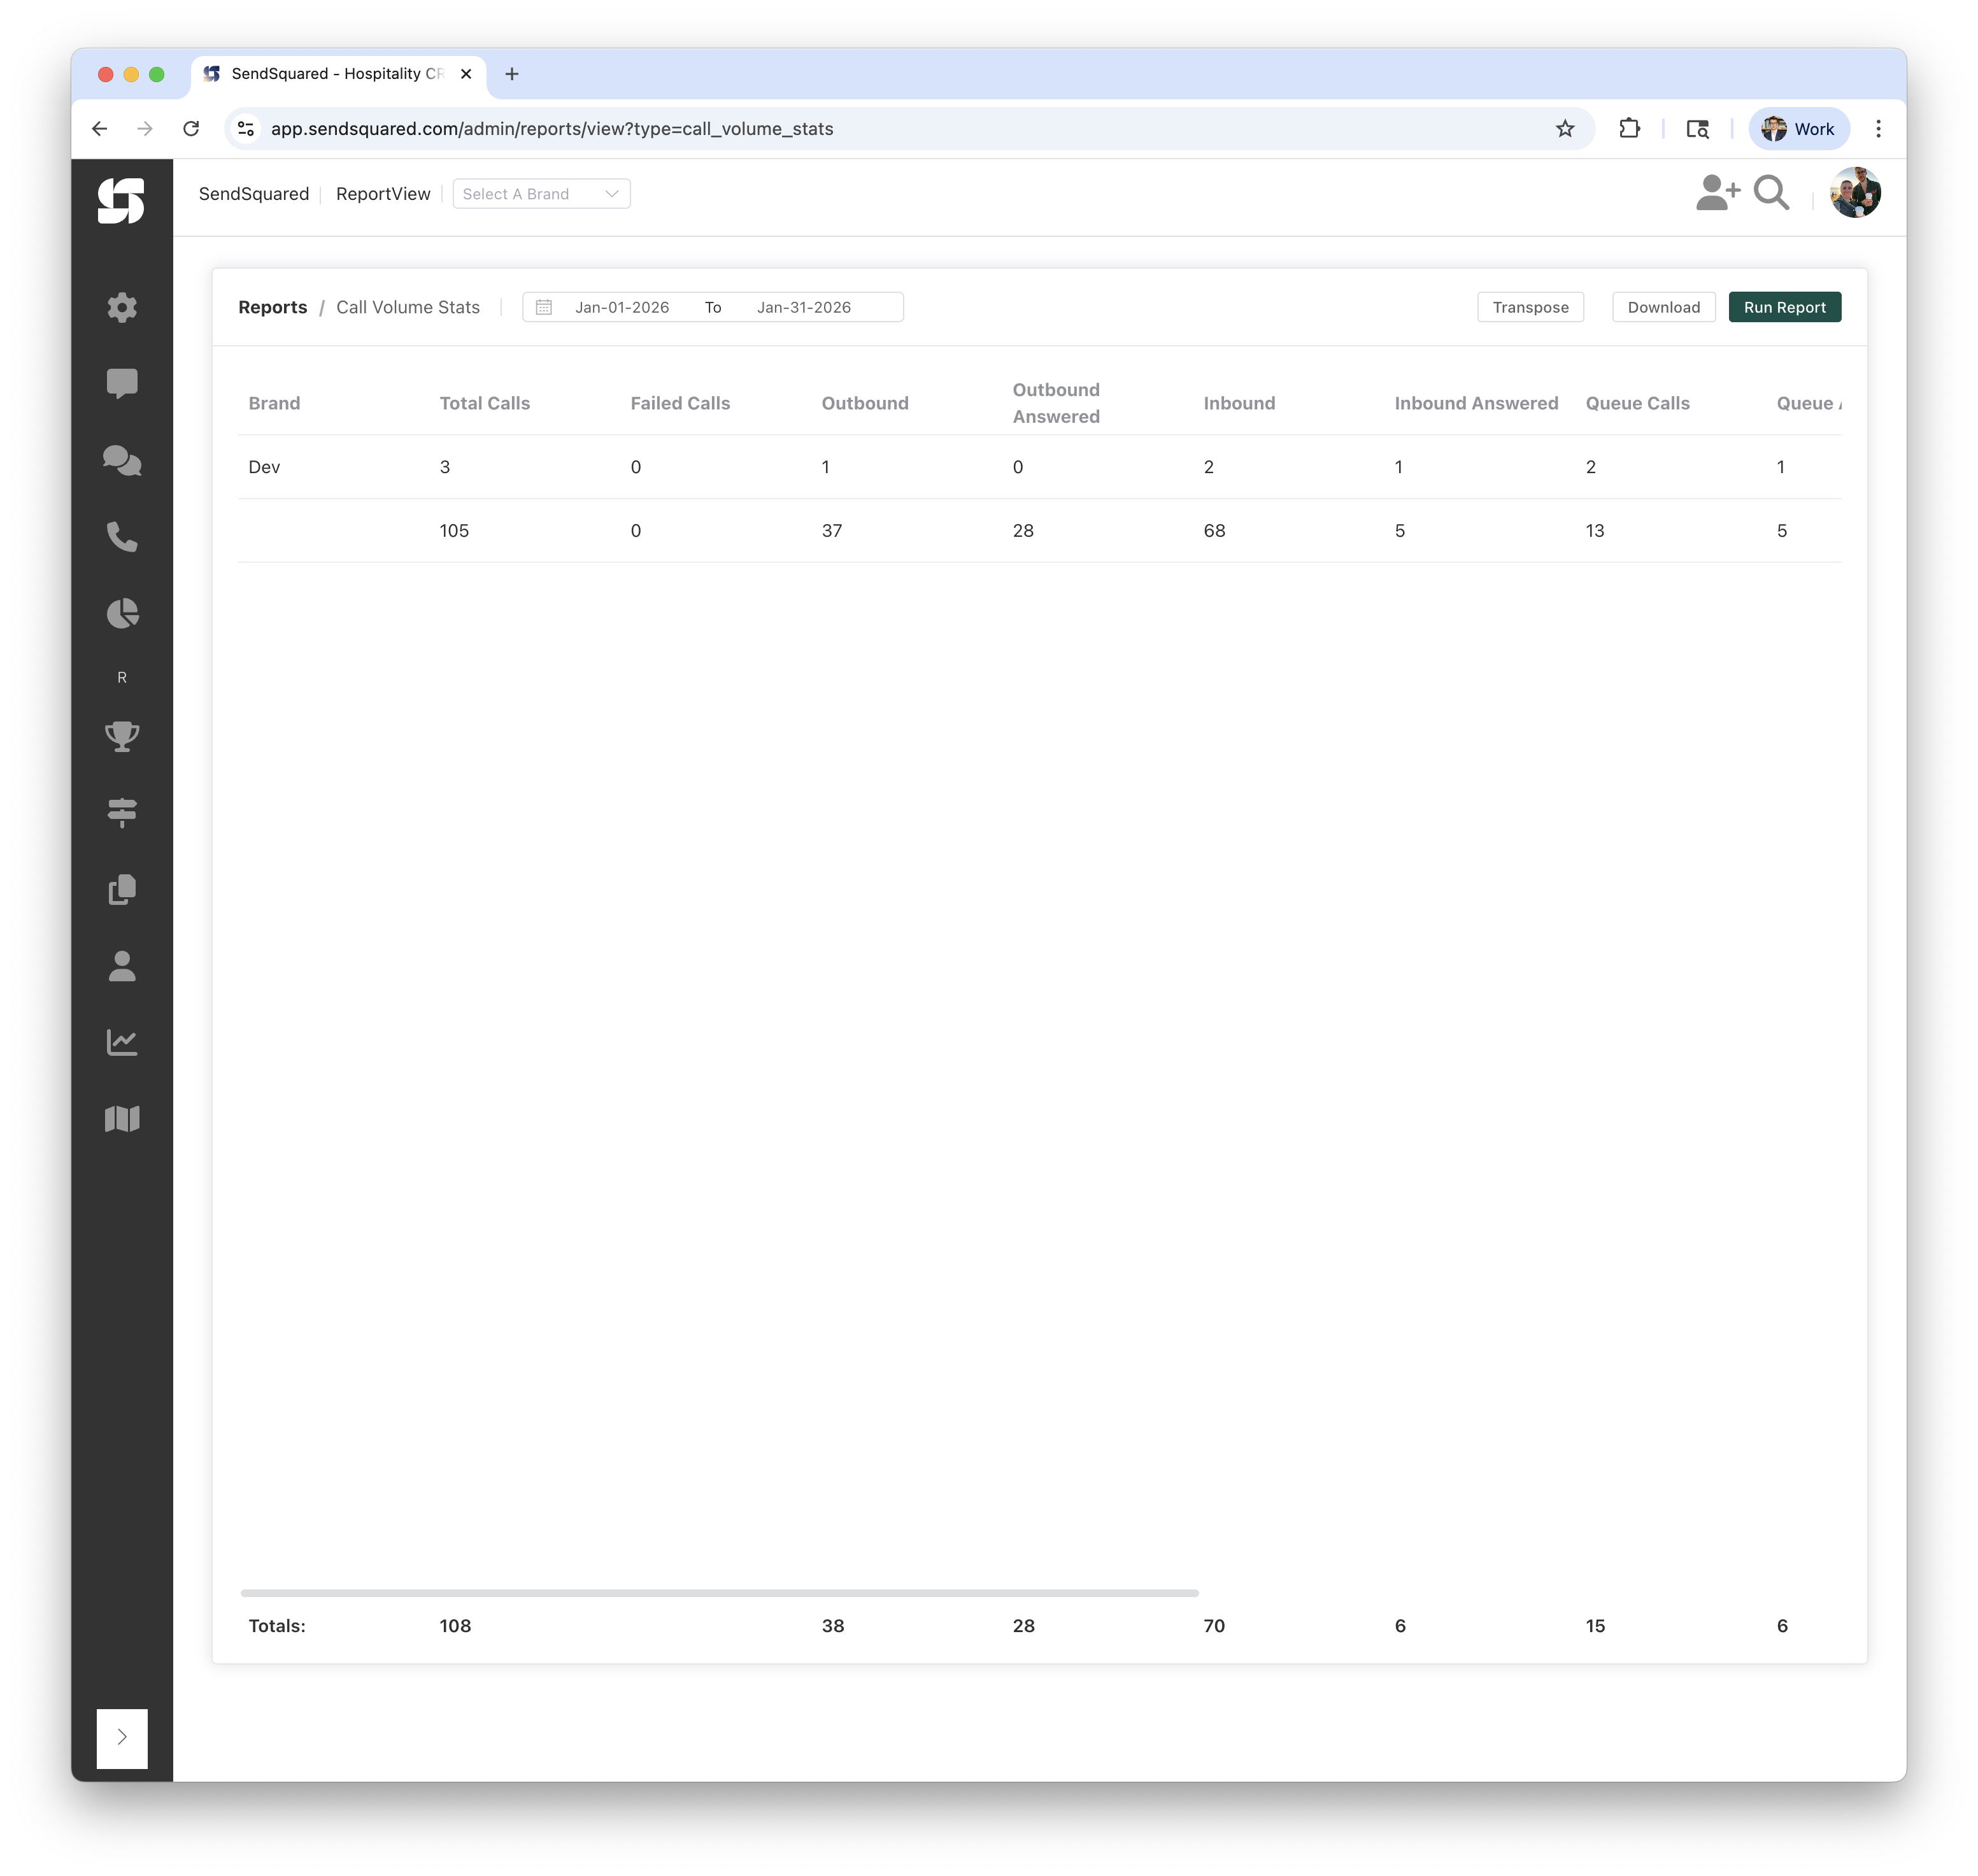
- Call Volume Stats: Same metrics grouped by brand
- Call Inbound Source Totals: Inbound calls by phone number and source