Call Volume By Hour Report
The Call Volume By Hour report provides an hourly breakdown of all call activity. It uses the same metrics as the Call Volume By Day report but groups data by hour, making it ideal for identifying peak call times and optimizing shift schedules.
Report Columns
| Column | Description |
|---|---|
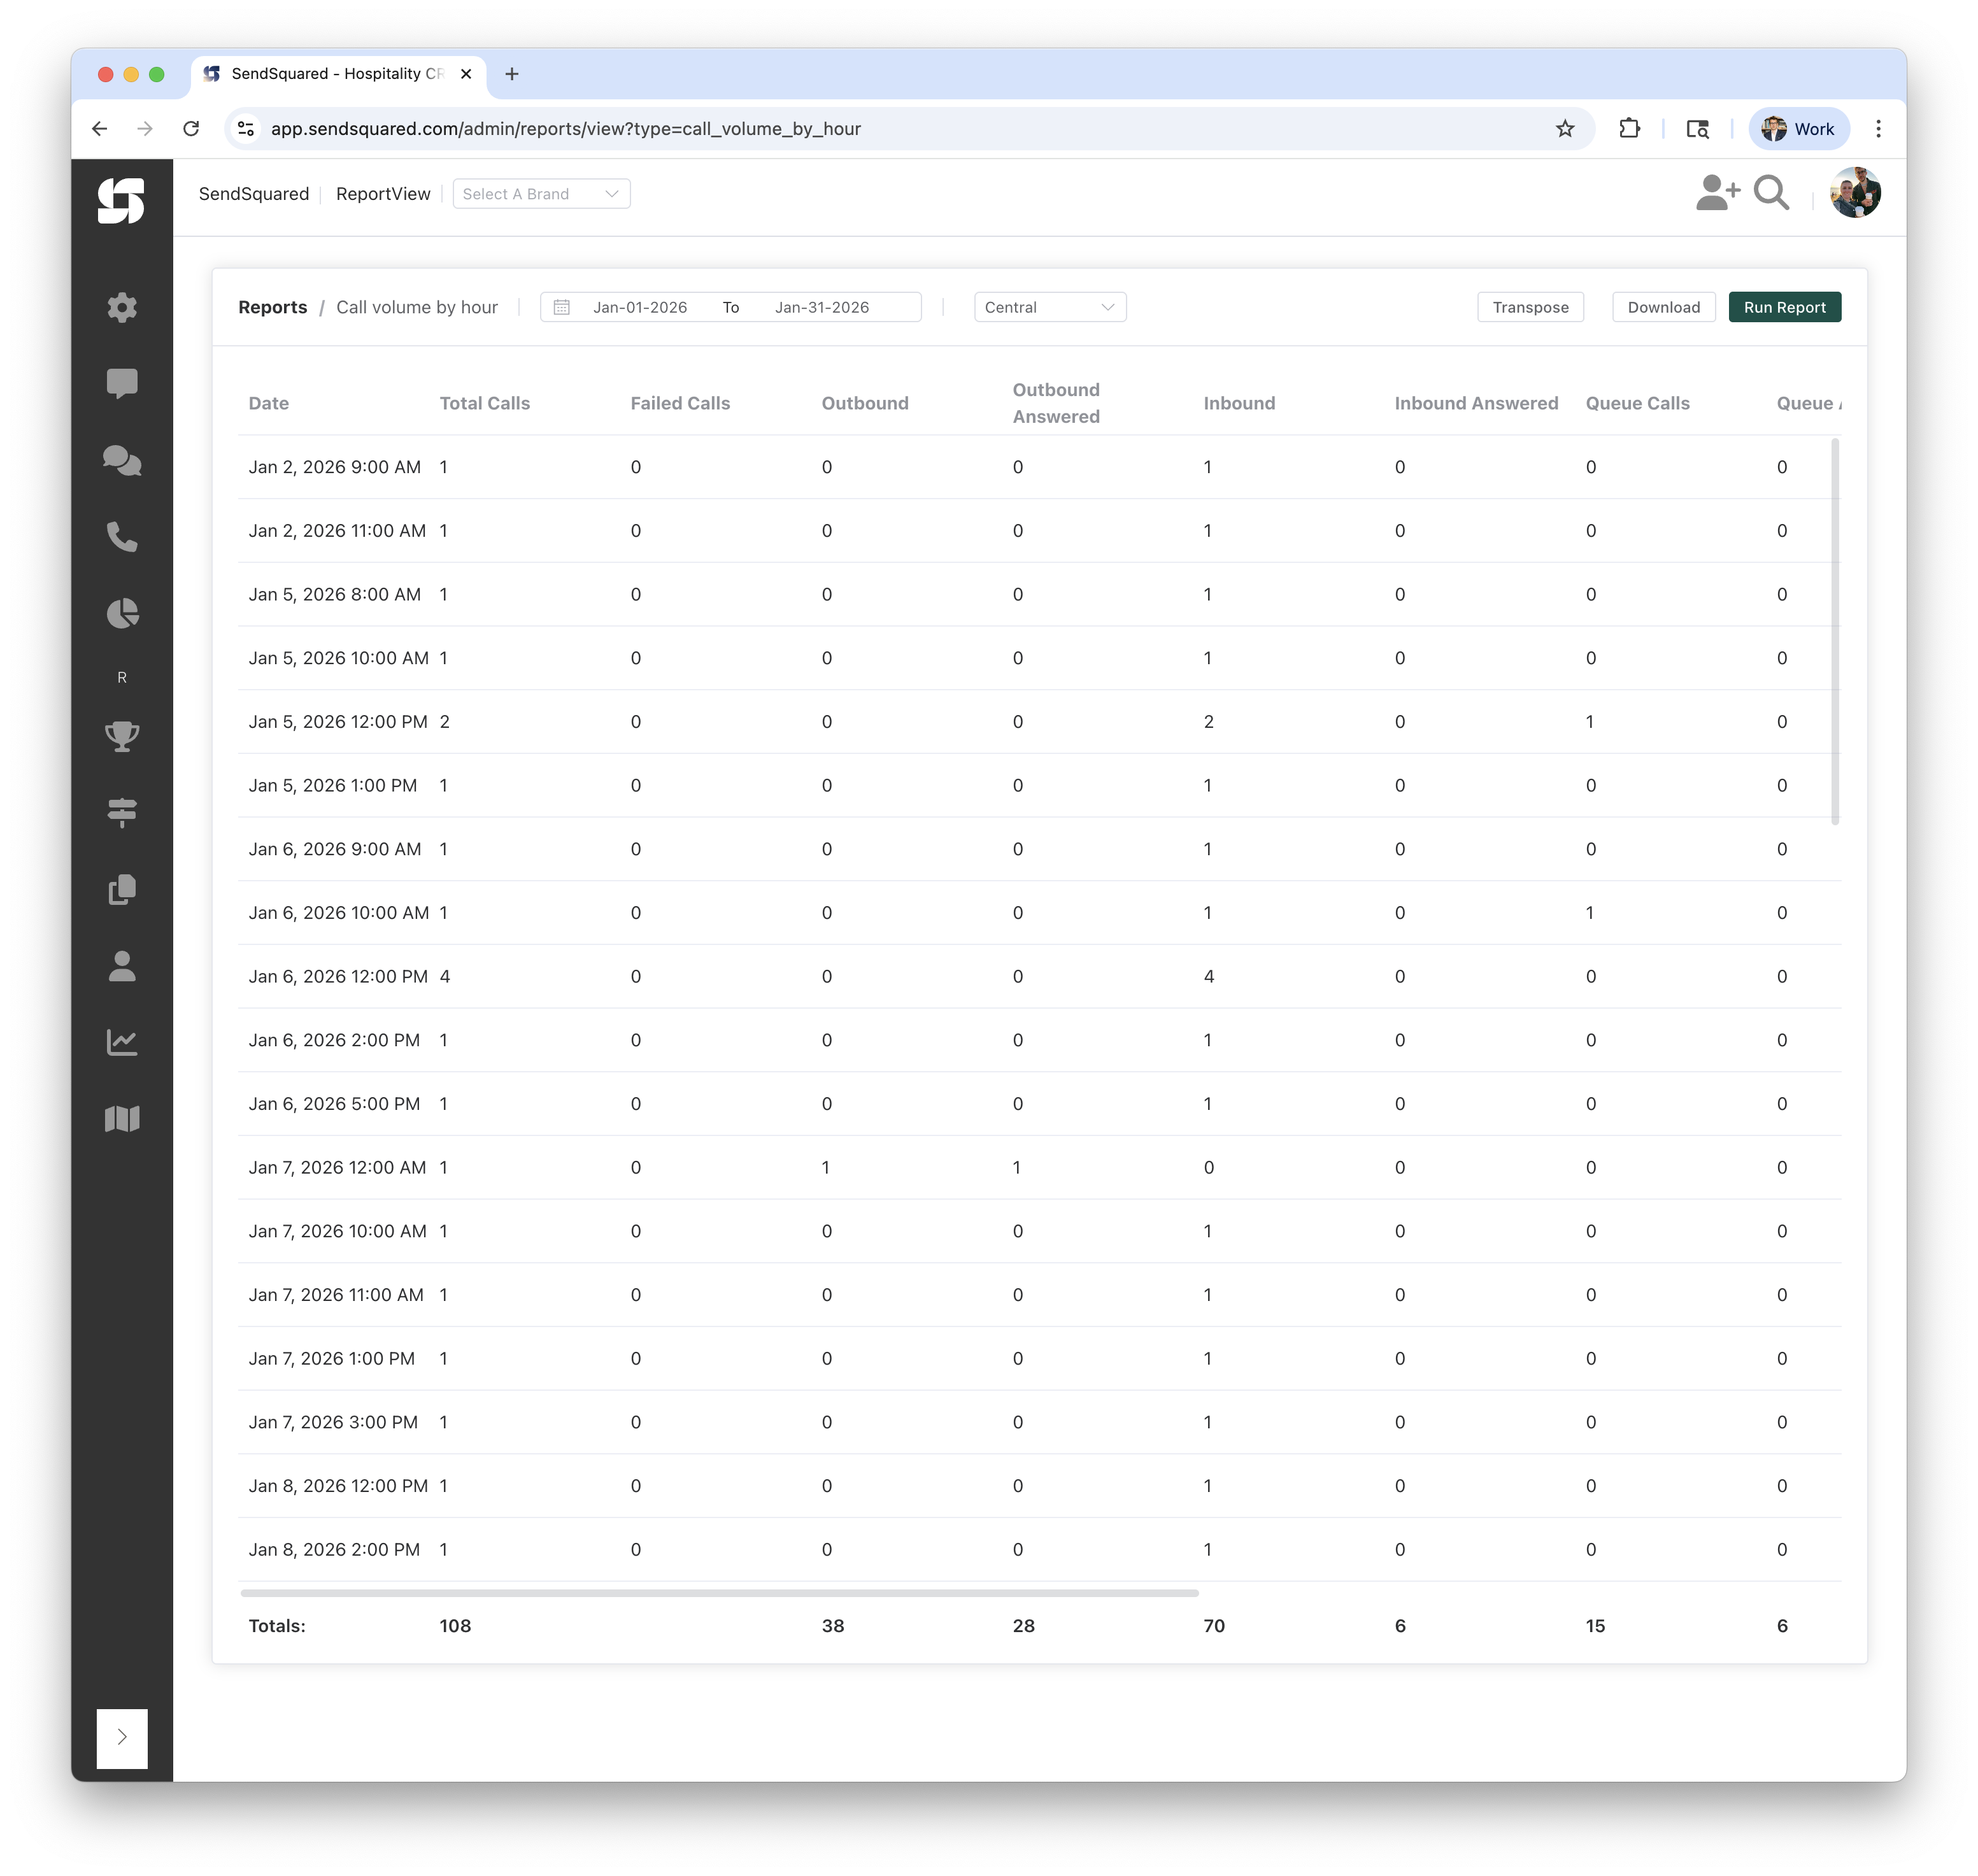
| Date | The date and hour (e.g., "Jan 6, 2026 12:00 PM") |
| Total Calls | Total number of calls during that hour |
| Failed Calls | Calls with a status of "failed" (did not connect) |
| Outbound | Number of outbound (agent-initiated) calls |
| Outbound Answered | Number of outbound calls that were answered |
| Inbound | Number of inbound (customer-initiated) calls |
| Inbound Answered | Number of inbound calls that were answered by an agent |
| Queue Calls | Number of inbound calls that entered the call queue |
| Queue Answered | Number of queued inbound calls that were answered |
| Answer Time | Average time (in seconds) from when an inbound call entered the queue until it was answered |
| Handle Time | Average time (in seconds) from when an inbound queued call was answered until the call ended |
| Hangups | Number of inbound queued calls that were not answered (caller hung up while waiting) |
| Completed | Number of calls with a status of "completed" |
| Transfers | Number of calls with a status of "transfer" |
| Voicemails | Number of calls that resulted in a voicemail |
How the Numbers Are Computed
All columns are computed identically to the Call Volume By Day report, with the only difference being that data is grouped by hour instead of by day. See that report for detailed explanations of each column's computation.
Timezone Handling
Timestamps are converted to your selected timezone before grouping by hour. This ensures that hours reflect your local time, not UTC.
Totals Row
The Totals row at the bottom sums all columns across all hours.
Report Filters
Date Range
- From/To: Select the date range for calls to analyze
- Example: Jan-01-2026 to Jan-31-2026
Timezone
- Purpose: Determines how calls are grouped into hours
- Options: Select from available timezones (e.g., Central, Eastern, Pacific)
Understanding the Results
Example Rows
| Date | Total Calls | Failed Calls | Outbound | Outbound Answered | Inbound | Inbound Answered | Queue Calls | Queue Answered |
|---|---|---|---|---|---|---|---|---|
| Jan 5, 2026 12:00 PM | 2 | 0 | 0 | 0 | 2 | 0 | 1 | 0 |
| Jan 6, 2026 12:00 PM | 4 | 0 | 0 | 0 | 4 | 0 | 0 | 0 |
This shows:
- The 12:00 PM hour on Jan 5th had 2 inbound calls, 1 of which entered the queue, but none were answered
- The 12:00 PM hour on Jan 6th had 4 inbound calls, none of which entered the queue or were answered
Hours With No Calls
Hours with zero calls are not included in the report. Only hours with at least one call are shown.
Use Cases
Shift Scheduling
- Identify peak call hours to ensure adequate staffing
- Find quiet hours where staff can handle other tasks
- Optimize break schedules around low-volume hours
Service Level Analysis
- Track answer rates by hour to identify problem times
- Monitor queue performance during peak hours
- Compare morning vs afternoon vs evening service levels
Capacity Planning
- Understand hourly call patterns to right-size your team
- Identify if after-hours coverage is needed
- Plan for seasonal or promotional surges at specific times
Related Reports
- Call Volume By Day: Same metrics grouped by day
- Call Volume Stats: Same metrics grouped by brand
- Call Stats: Individual call-level detail