Call Volume Stats Report
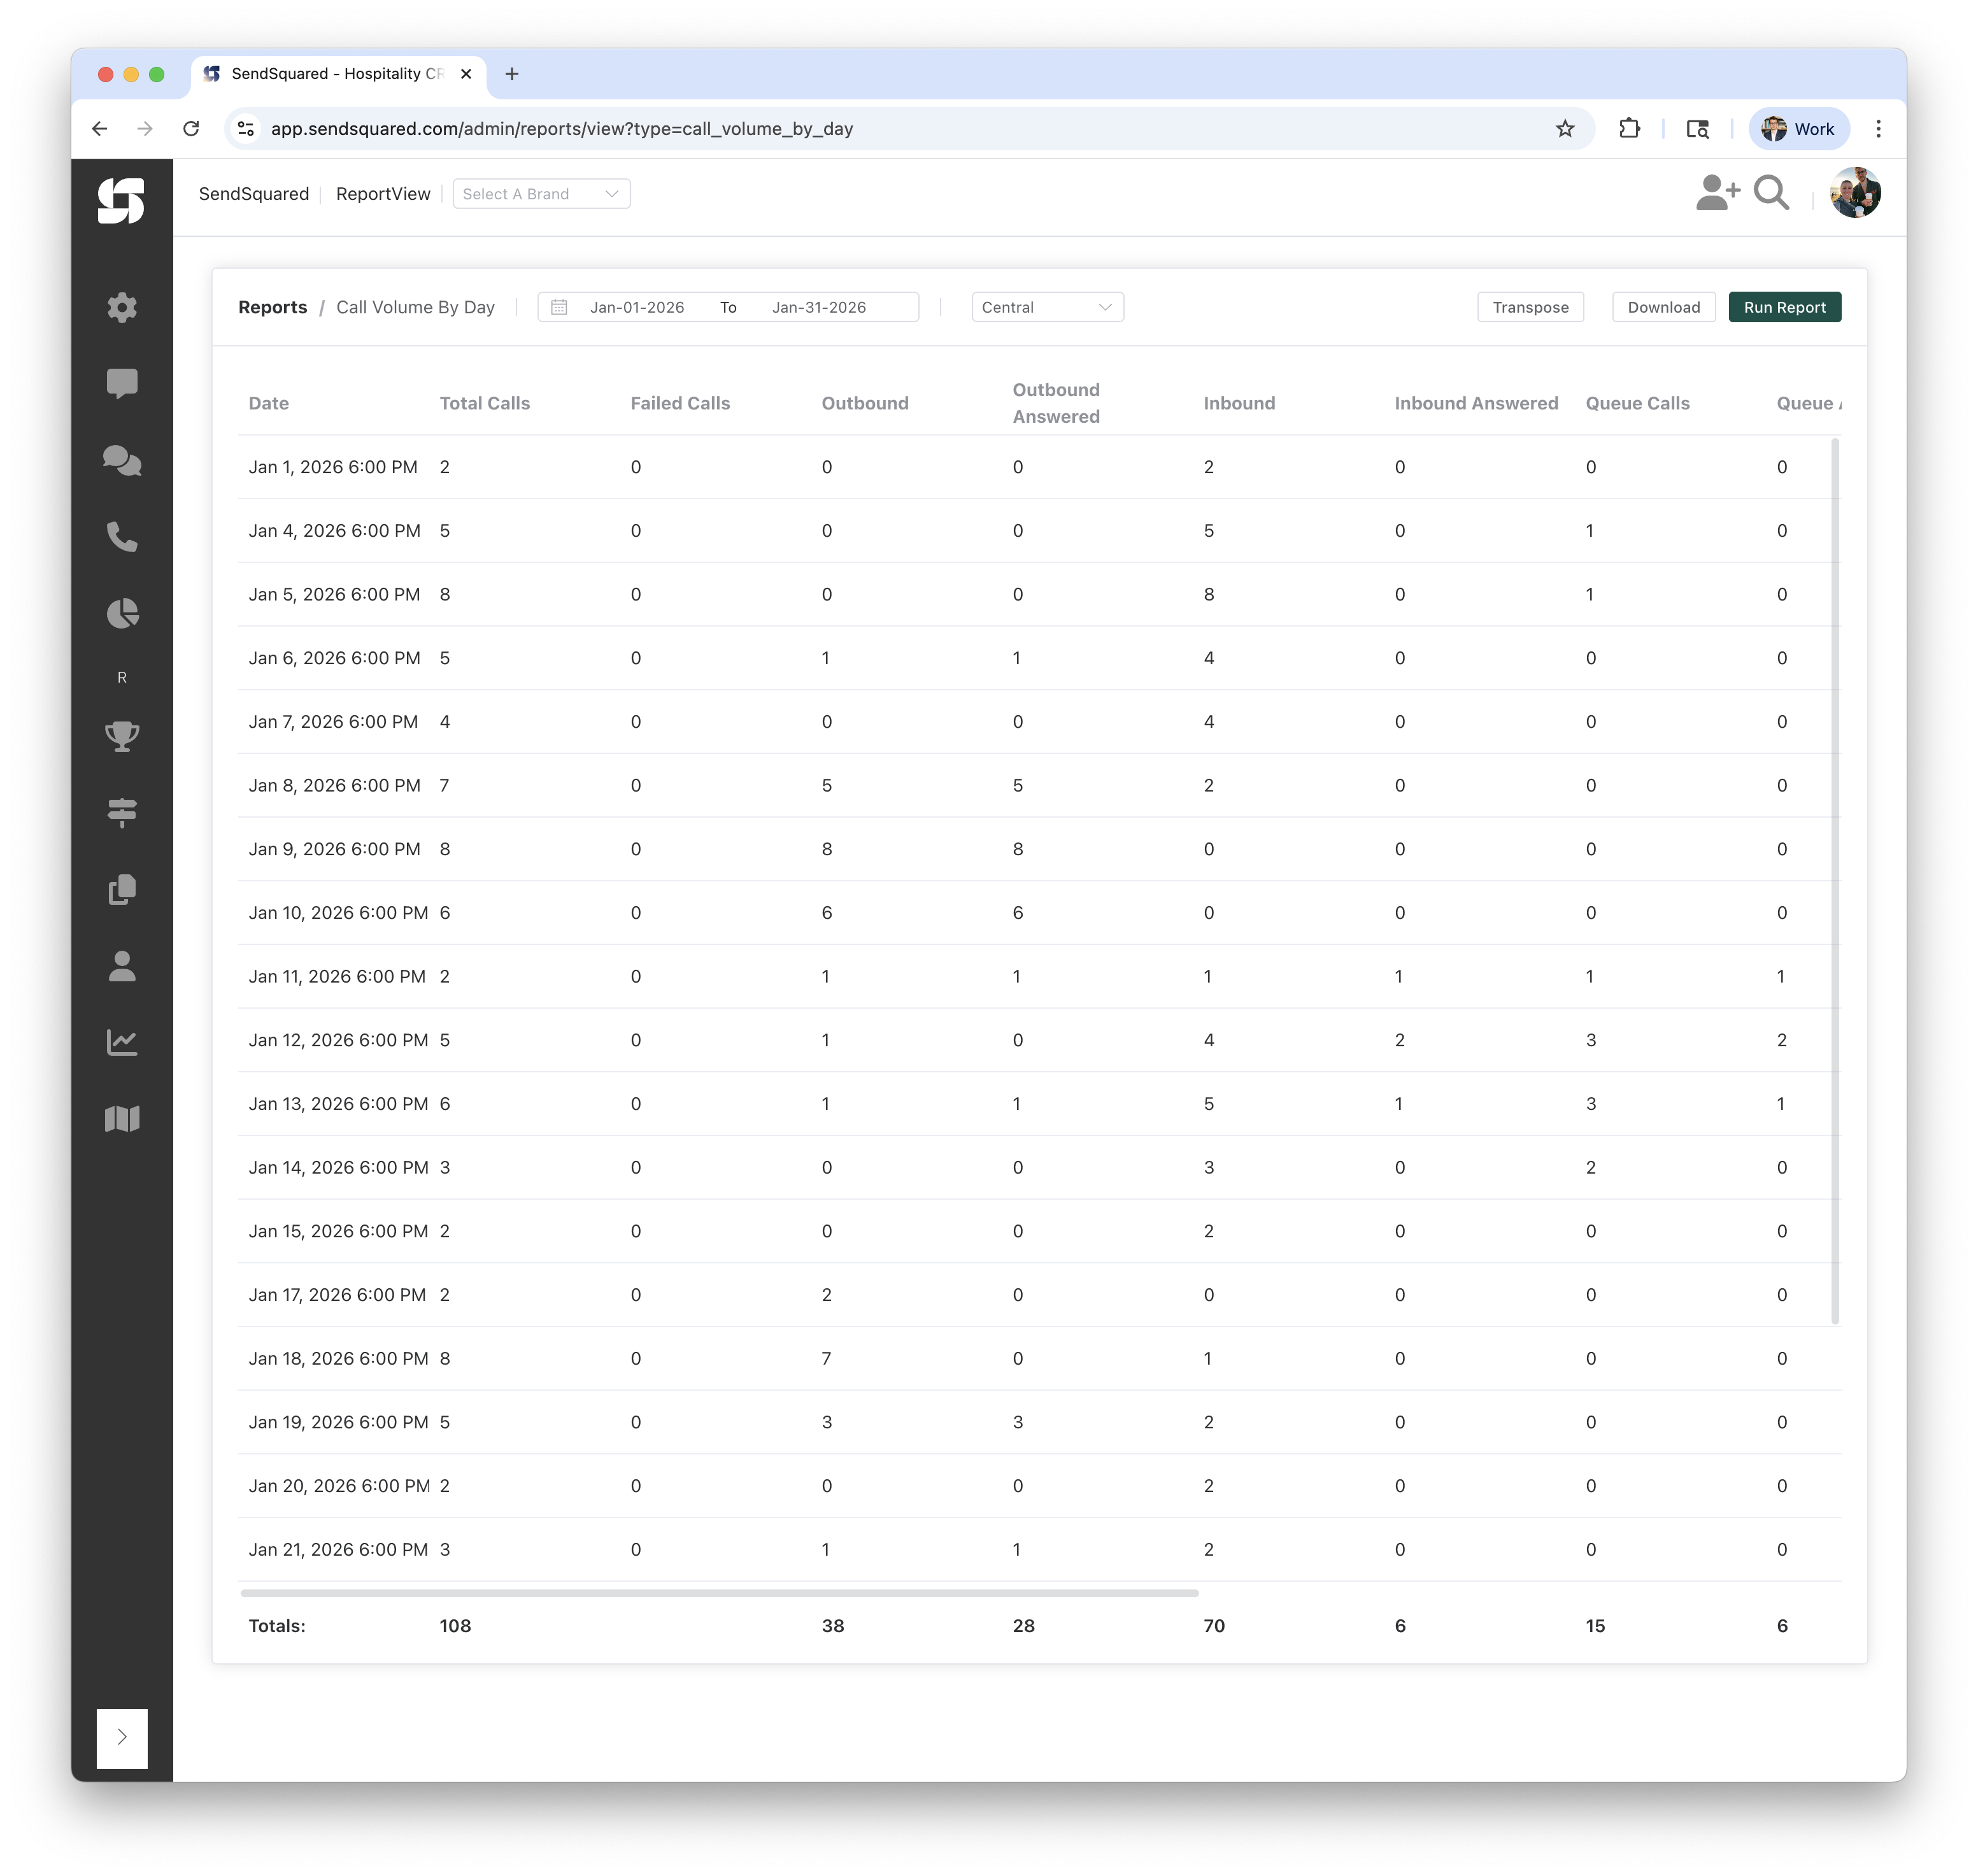
The Call Volume Stats report provides a high-level overview of call activity grouped by brand. It gives you a single summary row per brand, making it easy to compare call performance across your brands at a glance.
Report Columns
| Column | Description |
|---|---|
| Brand | The brand name associated with the phone number that handled the call |
| Total Calls | Total number of calls across all directions and statuses |
| Failed Calls | Calls with a status of "failed" (did not connect) |
| Outbound | Number of outbound (agent-initiated) calls |
| Outbound Answered | Number of outbound calls that were answered |
| Inbound | Number of inbound (customer-initiated) calls |
| Inbound Answered | Number of inbound calls that were answered by an agent |
| Queue Calls | Number of inbound calls that entered the call queue |
| Queue Answered | Number of queued inbound calls that were answered |
| Answer Time | Average time (in seconds) from when an inbound call entered the queue until it was answered |
| Handle Time | Average time (in seconds) from when an inbound queued call was answered until the call ended |
| Hangups | Number of inbound queued calls that were not answered (caller hung up while waiting) |
| Completed | Number of calls with a status of "completed" |
| Transfers | Number of calls with a status of "transfer" |
| Voicemails | Number of calls that resulted in a voicemail |
How the Numbers Are Computed
All columns are computed identically to the Call Volume By Day report, with the difference being that data is grouped by brand instead of by date.
Brand Assignment
Each call is associated with a brand through its phone number. The call's number_id links to a phone number, which in turn links to a brand via brand_id. Calls on phone numbers not assigned to a brand will appear with a blank Brand column.
Answer Time / Handle Time
- Answer Time: Calculated as the average of
answered_at - queued_atacross all inbound queued calls that were answered. This measures how long callers waited in the queue before an agent picked up. - Handle Time: Calculated as the average of
end_time - answered_atacross all inbound queued calls that were answered. This measures how long the agent spent on the call after picking up.
Both values are only computed when there are answered queue calls (uses NULLIF to avoid division by zero).
Hangups
Inbound calls that entered the queue (queued_at is set) but were never answered (answered_at is null). These represent callers who hung up while waiting.
Voicemails
Calls that have an associated voicemail record, identified by a LEFT JOIN to the voicemails table.
Totals Row
The Totals row at the bottom sums all columns across all brands.
Report Filters
Date Range
- From/To: Select the date range for calls to analyze
- Example: Jan-01-2026 to Jan-31-2026
Understanding the Results
Example Rows
| Brand | Total Calls | Failed Calls | Outbound | Outbound Answered | Inbound | Inbound Answered | Queue Calls | Queue Answered |
|---|---|---|---|---|---|---|---|---|
| Dev | 3 | 0 | 1 | 0 | 2 | 1 | 2 | 1 |
| 105 | 0 | 37 | 28 | 68 | 5 | 13 | 5 |
This shows:
- The Dev brand had 3 total calls: 1 outbound (unanswered) and 2 inbound (1 answered, both queued, 1 queue answered)
- 105 calls were on phone numbers without a brand assignment, with 37 outbound (28 answered) and 68 inbound (5 answered)
Use Cases
Multi-Brand Management
- Compare call volume and performance across brands
- Identify which brands drive the most call traffic
- Monitor answer rates by brand
Resource Allocation
- Determine if specific brands need more agent coverage
- Compare inbound vs outbound activity by brand
- Track queue performance to ensure service levels per brand
Performance Benchmarking
- Set and monitor KPIs per brand
- Compare answer rates across brands
- Identify brands with high failure rates that may need technical attention
Related Reports
- Call Volume By Day: Call metrics broken down by day
- Call Volume By Hour: Call metrics broken down by hour
- Call Inbound Source Totals: Inbound calls by phone number and source